True Work Observability: Why Productivity Metrics Miss the Real Work
Most productivity dashboards measure activity, not outcomes. Here's what "true work observability" means and how to track work that actually matters.
Ever stare at a productivity dashboard full of green checkmarks and active-status dots, and still have no idea if your team is actually getting anything done? You're not imagining it.
Most of what companies call "productivity tracking" measures things that are easy to count: hours online, lines of code, messages sent. None of that tells you whether real work happened, or whether it mattered.
That gap has a name now: "true work observability". It's the idea that real visibility into work means seeing outcomes and context, not just activity. Here's what it actually means, why old metrics fail, and how to build something better.
What Does "True Work Observability" Actually Mean?
Observability is a borrowed term from software engineering. It means you can understand what's happening inside a system just by looking at the signals it gives off (metrics, logs, traces).
Applied to work, it means the same thing for human effort: can you tell what's really happening, not just that someone is "active"?
The key distinction:
Old approach
True observability approach
Tracks presence (online status, hours logged)
Tracks outcomes (what shipped, what changed)
Counts activity (emails sent, commits made)
Weighs impact (did it move the goal forward)
One metric for every role
Different signals for different kinds of work
Visible after the fact
Visible while work is happening
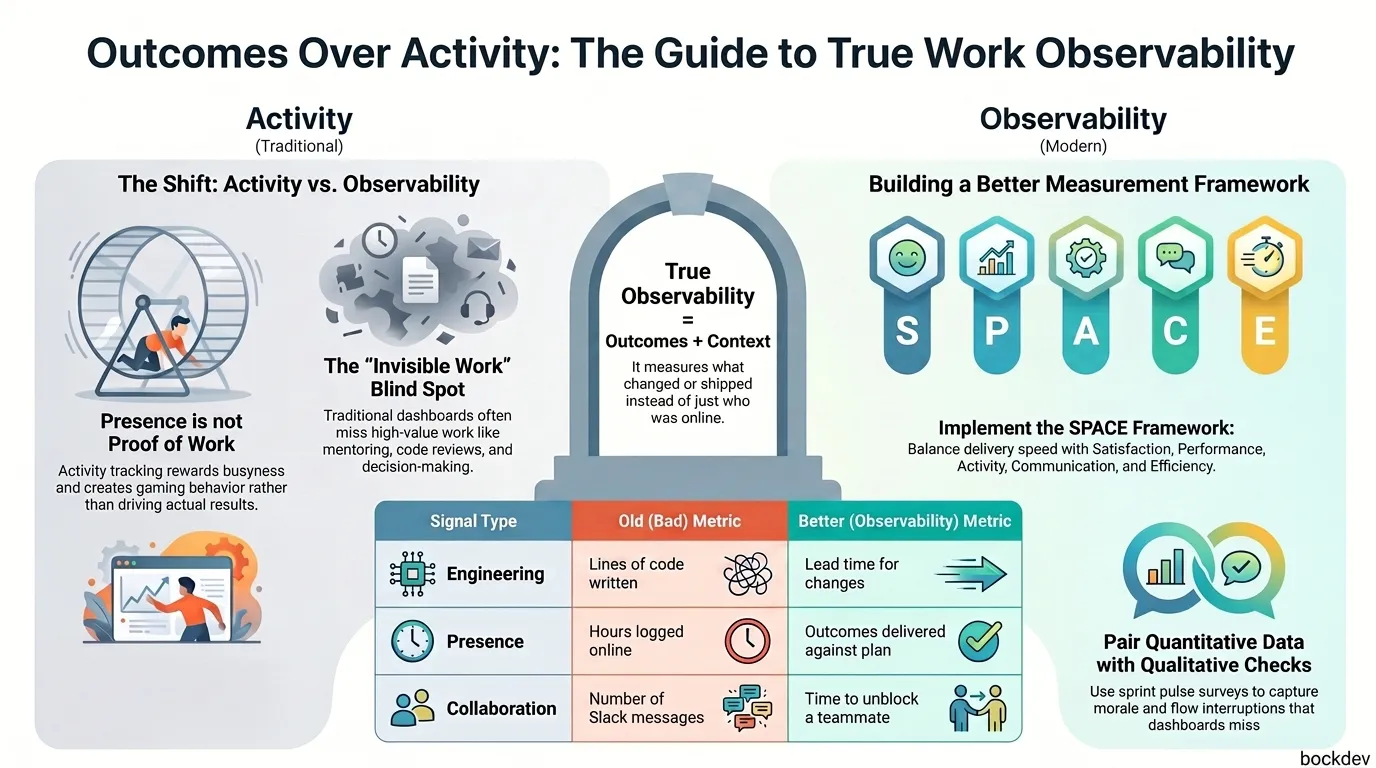
In remote work, quality matters more than quantity when it comes to collaboration, and true productivity comes from communication that actually drives decisions. That single line sums up the whole shift.
For years, presence was the easiest proxy for performance. But presence isn't proof of work, and remote setups make it harder for managers to verify effort just by looking around.
They reward busyness, not results. Tracking hours worked, emails sent, or meetings attended doesn't actually tell you whether meaningful work got done.
They erode trust. Random screenshots only prove a system is running, they don't show whether the work added value, and this kind of surveillance damages trust over time.
They miss invisible work. Code review, mentoring, documentation, and decision-making rarely show up on a dashboard, yet they drive most of the value.
They create gaming behavior. If "messages sent" is the metric, people send more messages. The metric stops measuring anything real.
This isn't unique to office work either. In engineering teams specifically, popular delivery metrics capture the pipeline but miss the large share of developer time spent on communication and coordination, leaving collaboration overhead and context switching completely invisible.
The Engineering Version: DORA, SPACE, and Their Blind Spots
If you work in software, you've probably heard of DORA metrics. They're useful, but they were never meant to measure people.
DORA measures delivery outcomes, not developer activity. It doesn't count lines of code, commits, or hours worked. It tracks how often code ships, how fast it reaches production, how reliably it runs, and how quickly the team recovers from failure.
The problem is that DORA only sees part of the picture:
DORA metrics are built for teams and organizations, not individuals. Using them to judge a single developer's performance creates bad incentives and distorted behavior.
DORA assesses operational performance, how efficiently code moves from commit to release. It says nothing about morale, team dynamics, well-being, or anything that happens before commit or after release.
A large share of developers don't think their company's productivity metrics reflect their actual work, which points to a measurement problem rather than developers complaining without cause.
That's where the SPACE framework comes in. SPACE looks beyond raw output to cover developer experience, satisfaction, communication, and organizational enablement, giving teams a more human-centric view alongside speed-based metrics.
A simple way to think about the five SPACE dimensions:
Step 2: Pull data from where work already happens, not from a separate monitoring layer. A simple pull from your CI/CD and issue tracker is enough to start:
Step 3: Pair every quantitative metric with a qualitative check-in. A short pulse survey once a sprint catches what dashboards can't:
Q: How often were you blocked waiting on someone else this week?Q: Did you have uninterrupted time to focus on deep work?Q: Rate your confidence that last week's work mattered: 1-5
Step 4: Review metrics with the team, not over the team. Closing the gap between what companies measure and what people believe reflects their real contribution is what actually improves productivity, not adding more dashboards.
What "Good" Observability Looks Like in Practice
Signal type
Bad metric
Better metric
Engineering output
Lines of code written
Lead time for changes, change failure rate
Collaboration
Number of Slack messages
Time to unblock a teammate
Presence
Hours logged online
Outcomes delivered against plan
Quality
Tickets closed
Tickets closed without reopening
Well-being
None tracked
Self-reported burnout, flow interruptions
The common thread: measure what happened as a result of the work, not what the work looked like from the outside.
Using one metric to judge a whole team. No single number, DORA or otherwise, captures a complex job.
Applying team-level metrics to individuals. DORA's design assumes team and organizational context; raw comparisons across teams without that context are misleading on their own.
Ignoring AI's effect on old baselines. As AI tools now write a large share of code and cut routine task time significantly, code churn is rising and delivery stability has measurably dropped, which means pre-AI benchmarks no longer apply cleanly.
Treating monitoring as a replacement for trust. Tools that watch people instead of outcomes tend to backfire over time.
1. What is "true work observability" in simple terms?
It means having real visibility into whether work is happening and whether it matters, not just whether someone looks busy or online.
2. Is work observability the same as employee monitoring?
No. Monitoring usually tracks presence and activity. Observability tracks outcomes, context, and signals that explain why something happened.
3. Are DORA metrics still useful in 2026?
Yes, but only as one layer. DORA metrics still matter, but they are no longer enough on their own.
4. What is the SPACE framework?
A model that measures Satisfaction, Performance, Activity, Communication, and Efficiency together, instead of relying on one output number.
5. Why do activity metrics like hours logged fail?
Because being present isn't the same as producing value. Someone can be online all day and accomplish little, or focus for two hours and ship something important.
6. Can small teams use this without expensive software?
Yes. Pulling basic stats from your existing CI/CD and issue tracker, plus a short survey each sprint, covers most of what you need to start.
7. How does AI change productivity measurement?
AI tools now write a substantial share of code and cut routine task time, which is pushing older, human-only baselines out of date.
8. Should productivity metrics be used for individual performance reviews?
Be careful. Most delivery metrics are built for teams, and applying them to individuals tends to create distorted incentives.
9. What's the biggest blind spot in most productivity dashboards?
Coordination and communication work. A large share of work time goes into communication and coordination that standard delivery metrics simply don't capture.
10. How often should we review these metrics?
Pair a lightweight weekly or sprint-based pulse check with a deeper monthly review of delivery and experience trends together, not in isolation.
My SaaS
Acluebox
Build modular and reusable system prompts with my SaaS,